What is Technical Analysis?
What is Technical Analysis?
Technical analysis (TA) is the study of market action, primarily through the use of charts, analysing market demand and supply, for the purpose of forecasting future price trends and managing risk.
In this infographic, we will take you through the fundamentals of TA and steps you can undertake to formulate a trading plan!


3 Underlying Assumptions of TA
Firstly, TA is based on three assumptions, technical analyst believe that:

The Market Discounts Everything
Fundamental information to broad market factors have already been priced into the stock, and hence the analysis of price movements are largely driven by supply and demand.
Price Moves in Trends
Prices move in short, medium, and long-term trend. In other words, a stock price is more likely to continue a past trend than moving erratically.

History Tends to Repeat Itself
History tends to repeat itself, and in a cyclical manner. The repetitive nature of price movements is often attributed to market psychology, which tends to be predictable based on emotions like fear or greed.
The Big Picture – 3 Trends of Technical Analysis
As mentioned in the previous section, technical analyst believe in trend analysis, and that prices move in short, medium, and long-term trend:
1
Short-term Trend
0 – 6 weeks
Price movements are explained by high-technical condition and low fundamental condition.

2
Medium-term Trend
6 weeks – 9 months
Price movements are explained by balanced technical and fundamental condition.

3
Long-term Trend
9 months- 2 years
Generally, in line with economic cycle and price movements are explained by high fundamental
condition and low technical condition.


Formulate a Trading Plan with Technical Analysis


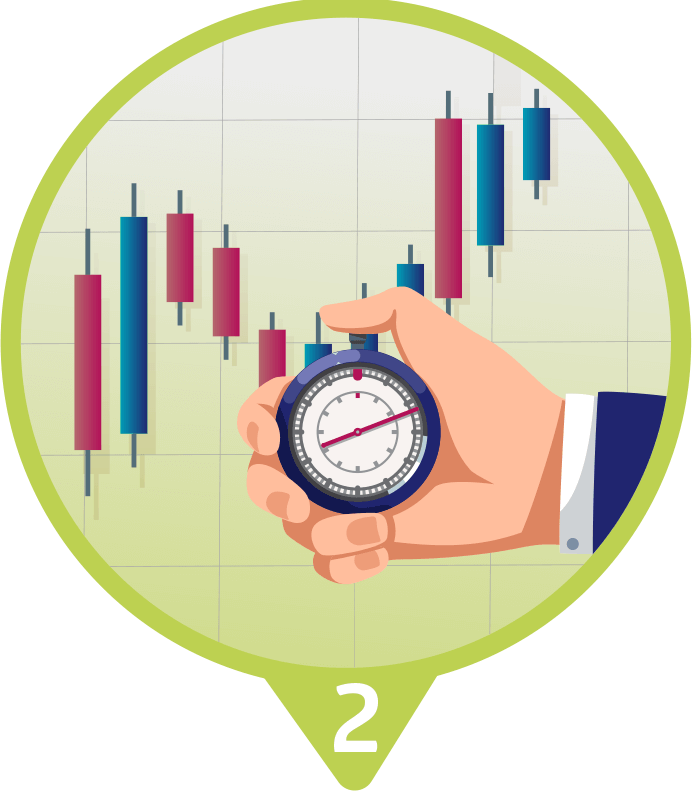
Step 1: Select a Swing Trading Strategy
‘Swing trading’ is a common term associated with TA, and it generally refers to ‘short-term view’ in technical trading. Swing strategies generally trades alongside the current trend or direction where traders aim to sell at highs (to maximise returns) and buy at significant lows (to minimise risk).
There are various long (bullish) and short (bearish) swing strategies, and traders can express these views via Structured Warrants or Daily Leverage Certificates listed on SGX.
Step 2: Manage Your Risk
After identifying the trade strategy, the next step is to manage risk for the trades. Exiting a trade upon breaking the stop lost price will help traders minimise their risk per trade and avoid risk of depleting a large portion of their capital.

Step 3: Keep a Trade Journal
Traders typically keep a record of their trades to help them check and monitor the progress of their trades.
They will then refine their decision-making process and identify areas to improve or maintain.
The following is an example of entries recorded in a typical trading journal.